Purpose
This lab is an introduction to Snort and its output. It focuses on helping a new user get comfortable with the tool.
Exercise 1
1)Start by exploring Snort’s available command-line options. Run the following command to view help information and understand what parameters are available:
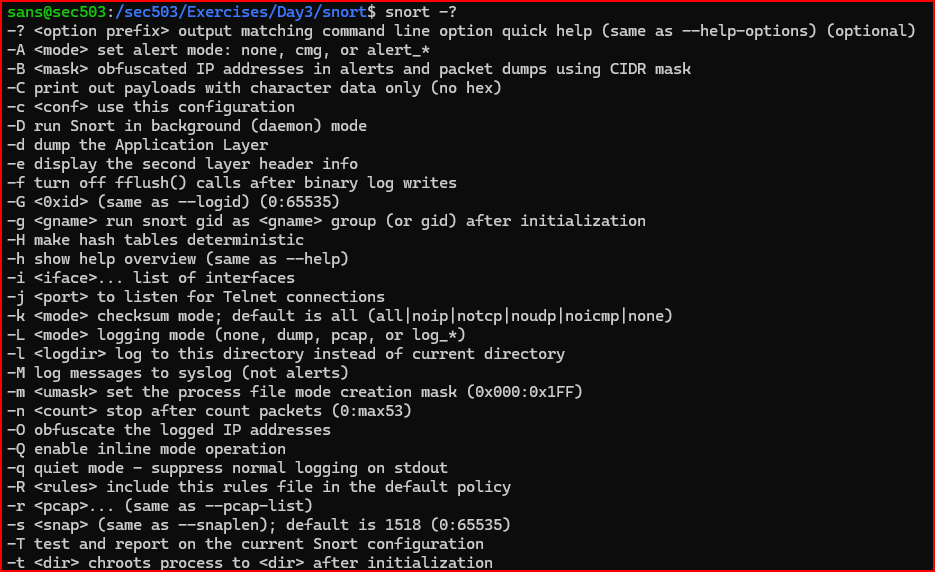
2)Which command-line option should you use to specify a particular configuration file when running Snort?
Going through the above list of available parameters, we find the below option

Exercise 2
1)Which Snort command-line option can be used to check the current configuration and generate a report?

2)Launch Snort using the correct option to validate the configuration and generate a report, pointing to the snort.lua configuration file located in /sec503/Exercises/Day3/snort/.
Using the 2 questions above, we can easily answer this question:
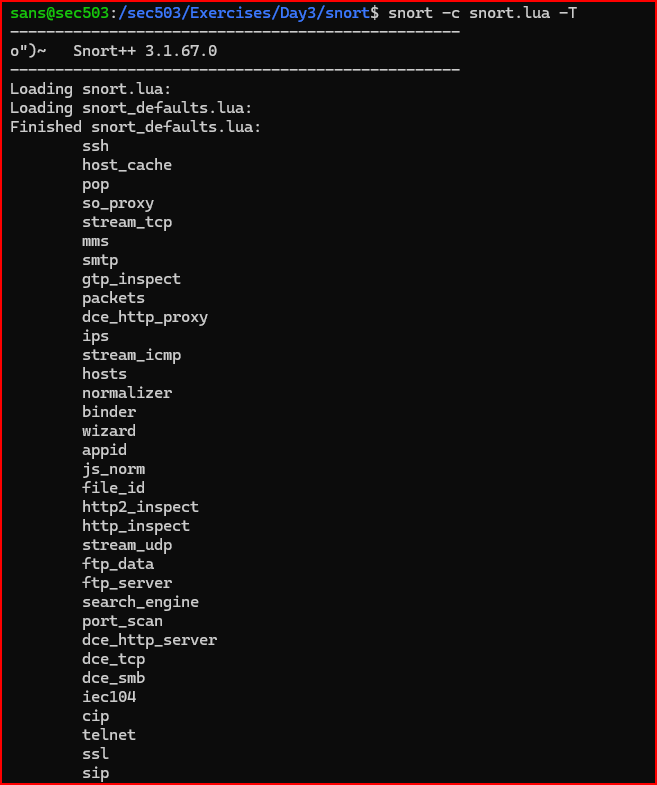
3) After running Snort, you’ll see a stream of initialization messages. Does the snort.lua configuration file pass validation?

4) How many rules did Snort confirm it loaded?

5) Run Snort again with the -T option to test the configuration, but this time use snort-broken.lua as the config file. Add the -q option to reduce clutter by hiding the usual startup messages—this will make the error message easier to spot.
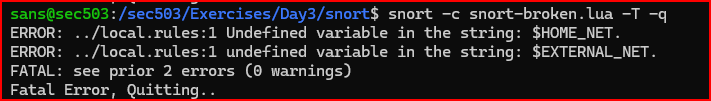
6) In which file is the error located? What is the specific error message?
The error is located in file called local.rules. Two variables are undefined in this file.
7) Use the diff command to compare the contents of snort.lua and snort-broken.lua. What differences do you observe?
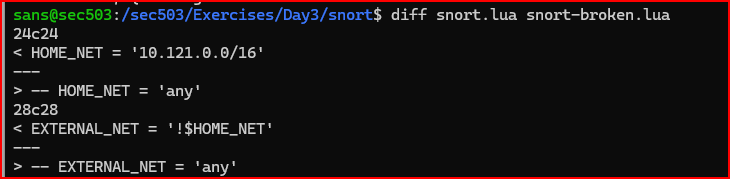
The main difference is that snort.lua defines two variables that are commented out in snort-broken.lua. Specifically, HOME_NET is set to the 10.121.0.0/16 network, while EXTERNAL_NET is defined as any network not included in HOME_NET (using the exclamation mark ! for negation). These variables help Snort distinguish between IP addresses inside the monitored network and those outside of it. In snort-broken.lua, these variable definitions are disabled using comment markers (--), so they aren’t loaded. Snort 3 requires that both HOME_NET and EXTERNAL_NET be properly set.
Exercise 3
This task is about running Snort in IDS mode. You’ll be using a configuration file and analyzing traffic from a packet capture file instead of live network data. For this, use the file named sample.pcap, located in the /sec503/Exercises/Day3 folder.
1) The goal is to run Snort using the snort.lua configuration file and see alerts on your console. To make this work, you’ll need to use a few options that haven’t been covered yet.
To accomplish this task, I ran snort with the below options:

2) Looking at the alert output, you’ll notice that after the GID, SID, and revision number, there’s a message, followed by a priority level. After that, it shows the protocol, the source IP address and port, and then the destination IP address and port (shown with the arrow symbol “->”). What are the values for the protocol, source IP and port, and destination IP and port?
The protocol is TCP. The source IP address is 10.121.70.151. The source port is 21 (FTP). The destination IP address is 10.234.125.254 and the destination port is 2217.
Exercise 4
Task: Run Snort in IDS mode and make sure logging is enabled.
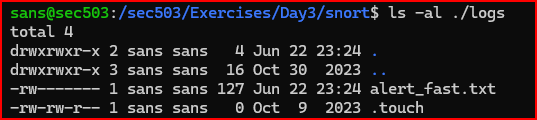
1) In the previous exercise, you saw that Snort does not show alerts by default unless it’s specifically told to. Figure out how to configure Snort so it logs fast alerts to a file. The alerts should be saved in the logs directory, located in the current folder or at /sec503/Exercises/Day3/snort/logs.
Wed can use the -l option to log a given file to a desired directory:

The file was correctly saved in the chosen directory:
2) Look at the content of this file

This is the same content as what we saw in the console output above.
3) Review the available logger plugins again and identify one that supports both event and packet logging.
The --help-plugins option provides detailed information about the different plugins that are available. Looking at the list, the unified2 plugin appears to be a good choice. This plugin can be run with the -A option:
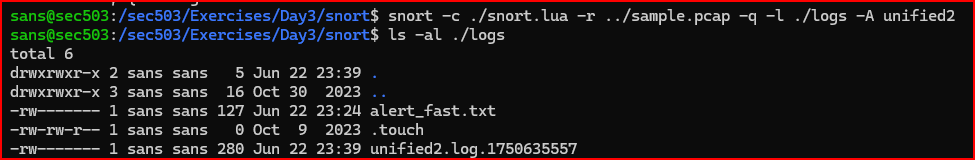
After the unified2 log file has been created, it can be read using tools such as u2spewfoo and u2boat. Running u2spewfoo on the file will display the alert and a packet dump showing what triggered it.
Leave a Reply